

M&A Deals - 20 Years of M&A

M&A Deals - 20 Years of M&A
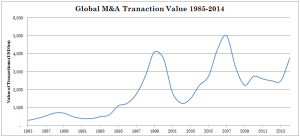
Listed below are two charts that show global M&A volume and value for the last 20 years. We thought that these charts would give our readers some insight into M&A over the last two decades.
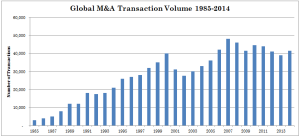
Overall, it’s interesting to note the increase in M&A activity from 1985. Twenty years ago, M&A was not as popular of a tool as it is today. In the 1980s companies would take the time to identify a new location, design and build a factory, and start selling product. Over the years, management teams have realized that with less risk an existing business could be purchased and produce faster results.
One can also observe the cyclicality of M&A. There were peaks in deal volume in 1991, 2000, and 2007. The increasing activity from 1995 to 2000 was the result of Y2K and the dot com era, which became the dot bomb era!
The takeaway of these charts is that M&A follows financial cycles like all of the economies around the world. In down cycles, one can see that the value of transactions decreased more dramatically than the volume. This means that sellers received less value for their businesses.
We’re all hoping that the current strong M&A markets continue forever, but the reality is that like all cycles it will end. That’s certain. What’s uncertain is the timing.