

M&A Deals - Q1 2015 Activity
Global M&A Activity - Q1 2015
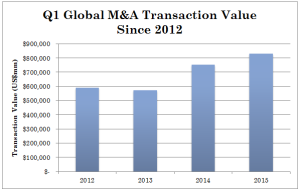
Globally, M&A transaction value for Q1 2015 was approximately US$831.5 billion, which showed growth of approximately ten percent over Q1 2014. The following chart shows Q1 global M&A activity from 2012 through 2015.
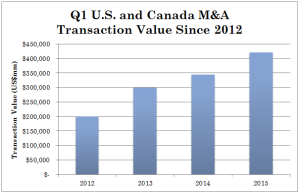
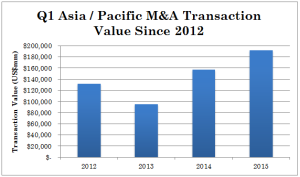
Both the US/Canada and Asia/Pacific showed an approximate 22 percent growth in M&A transaction value from Q1 2014 to Q1 of 2015. As shown in the following charts, both markets (except for 2013 in Asia/Pacific) have had steady M&A growth over the last few years.
US/ Canada M&A Activity - Q1 2015
Asia/Pacific M&A Activity - Q1 2015
European M&A Activity - Q1 2015
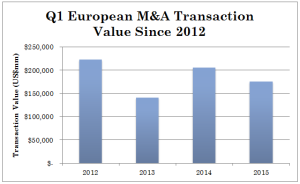
European M&A deals have slowed from last year, but have not slipped below 2013’s slowdown.
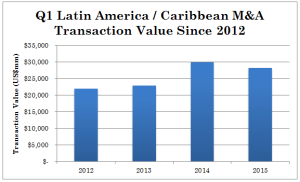
Latin America M&A Activity - Q1 2015
M&A deals in Latin America/Caribbean have slowed from last year, but are still ahead of 2012 and 2013.
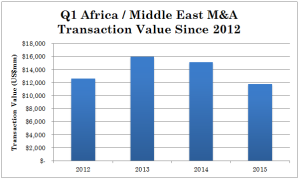
Africa/MEast M&A Activity - Q1 2015
M&A deals in Africa/Middle East have shown a steady decline from 2013’s high and, are, in fact, lower than even 2012.
While M&A activity is robust, sellers should move quickly. Over the years, Versailles Group has seen many sellers miss the "window." This was very apparent in the Great Recession as many buyers waited too long and found that not only did their businesses suffer during the recession, but that the value of their business declined tremendously.

![]()
![]()
![]()
![]()