

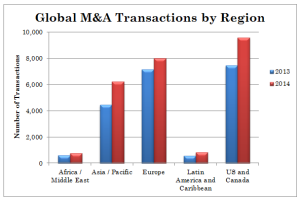
The chart below shows the first six months of M&A activity for both 2013 and 2014. In all geographies, the volume, year over year, has increased.
The gradual improvement in the world’s economies is driving this increase in M&A activity and pushing multiples up. For example, across all industry sectors, the Enterprise Value to Revenues multiple has increased from 1.17x in 2012 to 1.26x in 2013 to 1.50x in 2014.